Technical and Programming
3D Structural Biology
Representing 3D Structure in R (Structural Biology with r3dmol).
Forever Chemicals in the Water
Exploring the concentration of PFOA and PFOS in the drinking water.
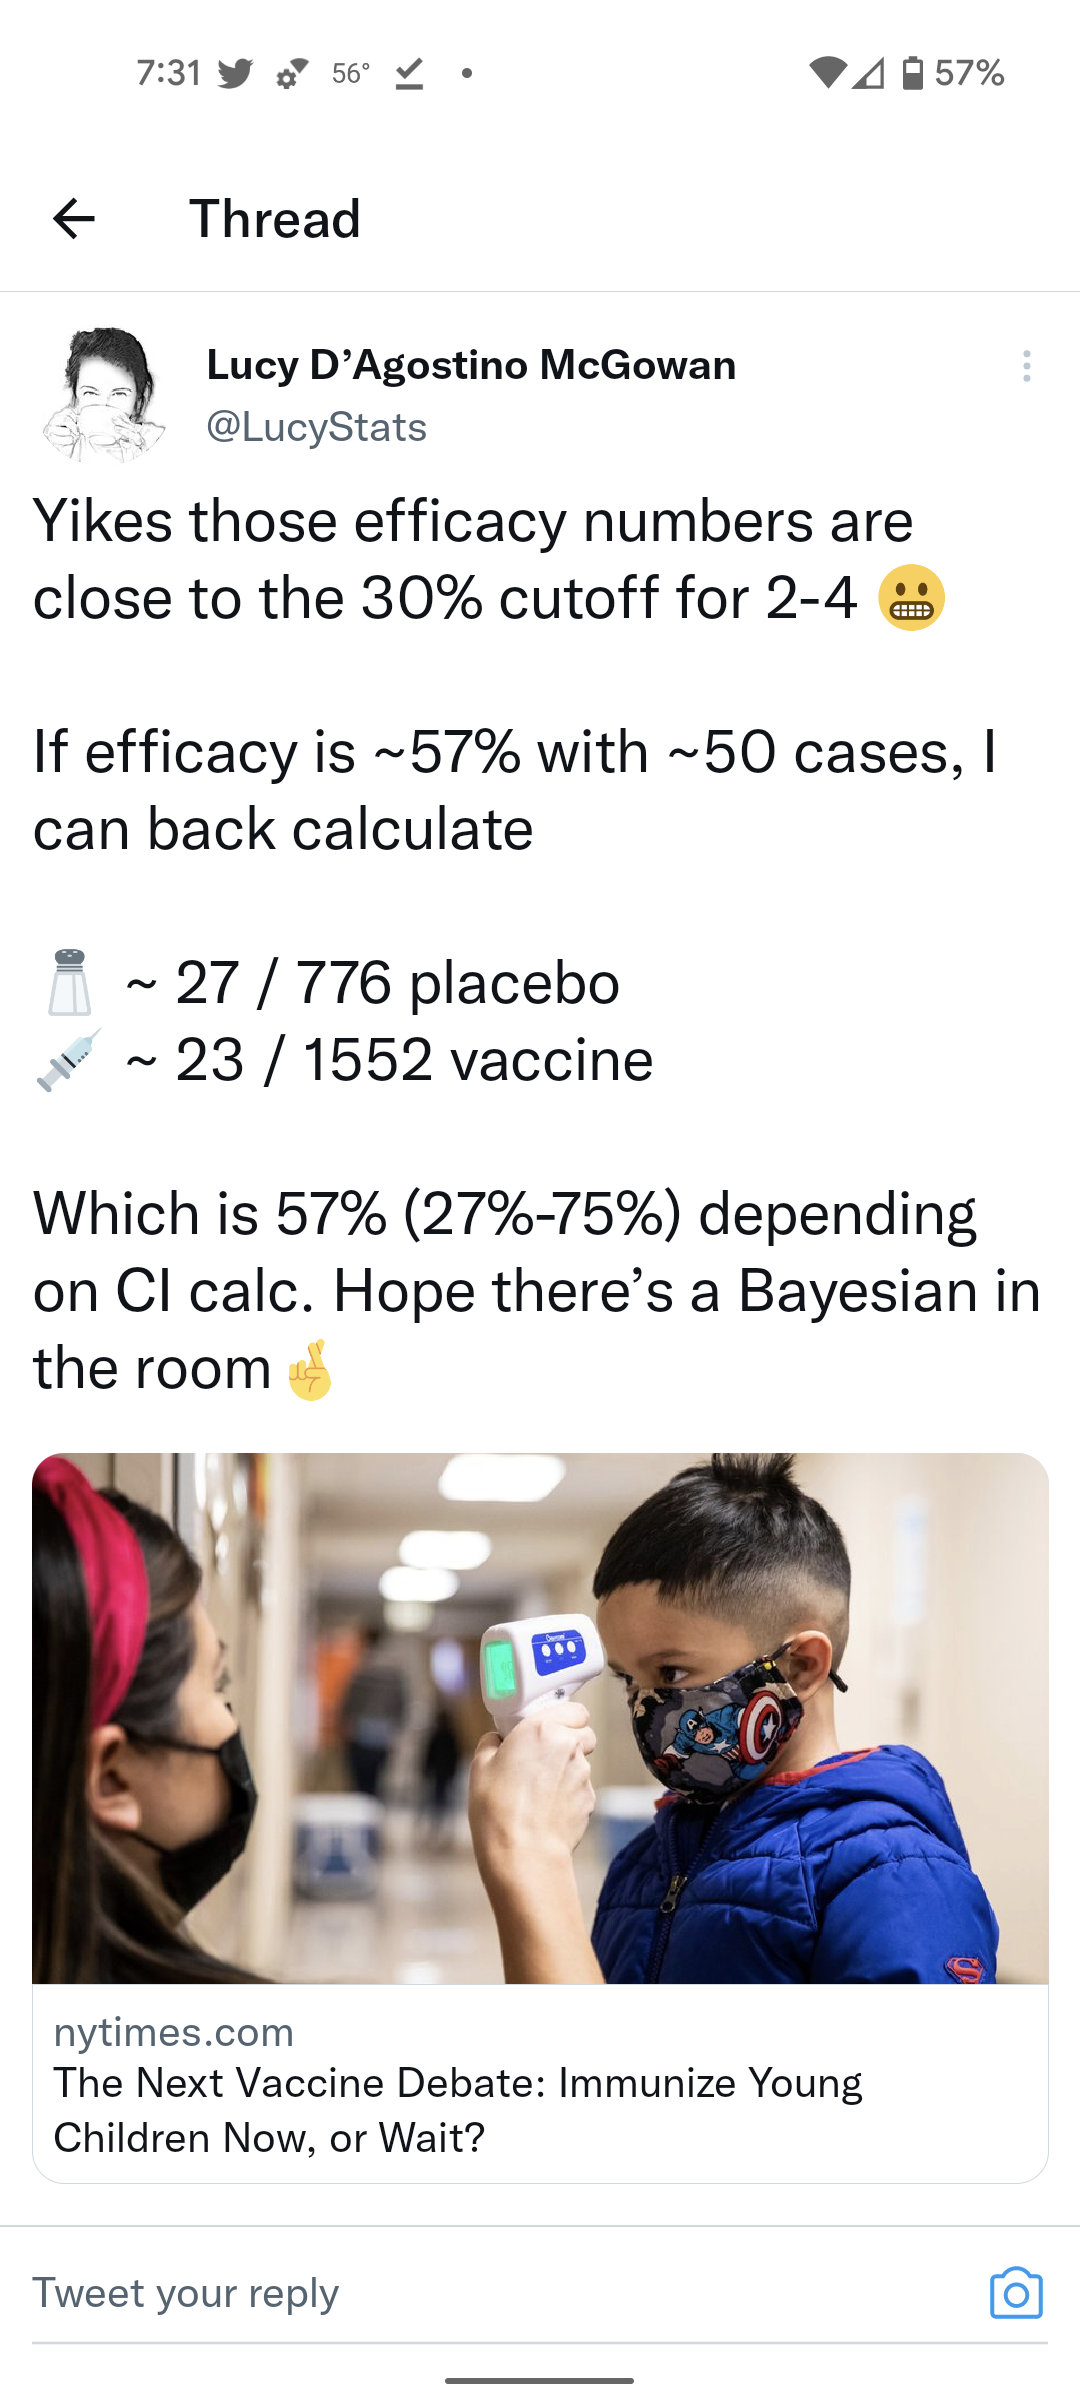
Can Bayesian Analysis Save Paxlovid?
Can Bayesian analysis be used to understand the impact of a treatment even though the frequentist results are not significant?
Advantage of Bayesian Hypothesis Testing
Here looking at the differences in traditional linear contrasts versus Bayesian Hypothesis testing.
Neutralizing Antibody Titres
How long someone has detectable neutralizing antibodies after vaccination is important in understanding the impact of vaccination on disease transmission. In this post I step through several different models and re-examine data from a prior paper.
Thinking About Viral Evolution
Exploring the impact of contact rate and virulence and their impact on the basic reproduction number of a pathogen.
Comparing Mortality Rates is Hard
Comparing crude mortality rates across NC during the COVID-19 pandemic shows differences, but fails to capture the nuance of potential sources of bias.
Time to Vaccinate
Using Bayesian Structural Times Series to estimate when some North Carolina counties will be vaccinated to a sufficient number.
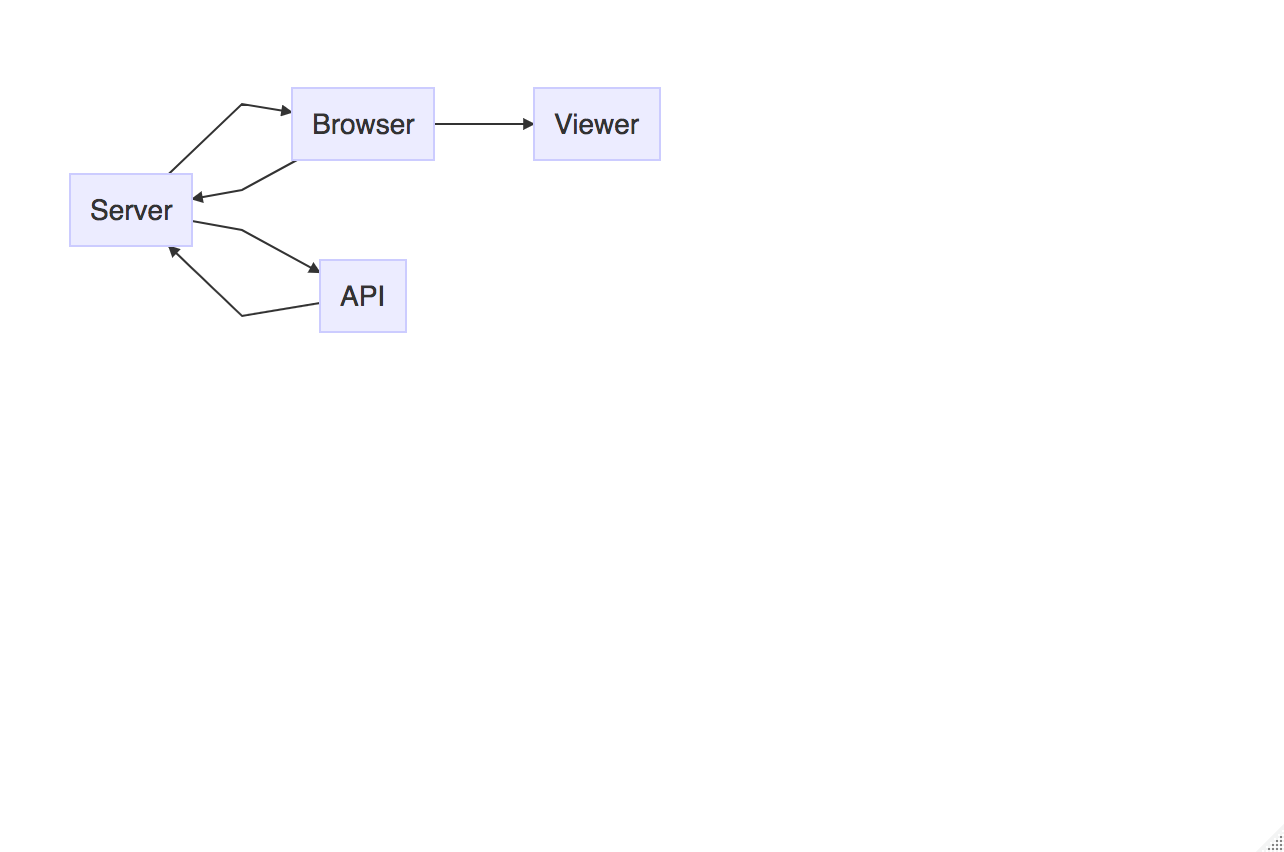
ShinyProxy Serving Websites
This post discuses using the ShinyProxy framework to serve static html sites. These products could be generated from single R Markdown documents to entire websites. Serving these items in containers gives you all the benefits of containerising your work along with the ability to authenticate through ShinyProxy if desired.
Bayesian SIR
In this post I review how to build a compartmental model using the Stan probabilistic computing language. This is based largely by the case study, Bayesian workflow for disease transmission modeling in Stan which has been expanded to include a second compartment for exposed individuals as well as utilise case incidence data rather than prevalence.
Negative Binomial Distribution and Epidemics
Super-spreading events can be characterised by a single case spreading to a larger than expected number of people. This phenomenon can be well-represented by a negative binomial distribution versus a standard Poisson distribution. In this post I review the overdispersion factor and how it can be parameterised in a model.
julia ABM SIR
Use Julia and R to run agent based models in Julia and visualise them in R.
Flatten the Curve
In the post I explore the potential growth rate of Covid-19 to Forsyth County, NC. This also includes looking at the kind of load that this virus could place on our existing healthcare systems. I strongly advocate for acting to delay to flood of potential community acquired infections.
Airflow on Windows Linux Subsystem
In this I detail the process for getting a working instance of Apache Airflow on Windows Linux Subsystem. This is a combination of several different posts spread across the internet. Apache Airflow is an exceptional program for scheduling and running tasks.
How About Impeachment?
In a previous blog post I looked at approval ratings. Now that impeach is the topic of the day, I think it would be wise to try the same methodology with the public opinion surrounding impeachment. While the data are much more sparse, it will be fun to examine.
Integrating Over Your Loss Function
Often times when doing an analysis, it is important to put the results in the context of the loss. For example, a small effect that is cheaply implemented might be the best use of resources. Using Bayesian modeling and loss functions we can better assess the impact and provide better information for decision-making when it comes to allocation of scarce resources (especially in the world of small effect sizes).
Defining a Project Workflow
Having a defined project workflow is important for many reasons. Consistency of design allows for easier sharing (you or other collaborators don’t have to look for things) and reduces some cognitive load by allowing you to focus on content and less on form. This is my lightly opinionated project structure. Of course these fews are ever evolving.
Finding the Needle in the Haystack
Sometimes instead of accuracy we need to look at different metrics. One such metric is sensitivity, which is a measure of those who are actually targets how many does the model correctly identify. This can be the metric of choice over accuracy when you are dealing with a raw event such as a terrorist attack or even student retention. It is always important to understand what metrics you are optimising your models on.
State Space Models for Poll Prediction
In this section I replicate some state space poll modeling that James Savage and Peter Ellis used in a few different scenarios. State space modeling provides a great way to model times series effects when the data are collected at irregular intervals (e.g. opinion polling).
Omitted Variable Bias
Exploring the implicates of omited variables in analysis.
Speeding Things Up with Rcpp
Metropolis Hasting samplers are typically slow in R because of inability to parallelise or vectorise operations. The Rcpp package allows a way to use C++ to conduct these MCMC operations at a much greater speed. This post explores how one would do this, achieving a >20x speed up.
Latex in ggplot2
This is a quick overview of a trick to add LaTex in ggplot2.
Replicating gsynth
The purpose of this post is to replicate the examples in the gsynth package for synthetic controls. This is a methodology for causal inference especially at the state level.
Hierarchical Time Series with hts
This is just a quick reproduction of the items discussed in the hts package. This allows for hierarchical time series which is an important feature when looking at data that take a hierarchical format like counties within a state or precincts within counties within states.
the power of fake data simulations
Looking at a blog post that Andrew Gelman posted on fake data simulations and HLM. The power of fake data simulations is that it really makes you think twice about what kind of effect for which you are looking as well as the power of your research design to detect it. This illustrates a really good practice for anyone looking to do this kind of analysis.
a foray into network analysis
Network analysis provides an way to analyse the interconnectedness of different networks. This can provide insight into social networks, interconnected groups of text, tweets, etc. Visualisations help to show these relationships but also some numeric values to quantify them.
models of microeconomics
Exploring the examples in Kleiber and Zeileis’ Applied Economics in R
IRT and the Rasch Model
Item Response Theory (IRT) is a method by which item difficulty is assessed and used to measure latent factors. Classical test theory has a shortcoming where the test-taker’s ability and the difficulty of the item cannot be separated. Thus there is a question of universalisability outside of the instrument. Additionally, the models make some assumptions that mathematically may not be justified. In come IRT which handles some of these issues.
gghighlight for the win
“Exploring the power of gghighlight package to automatically highlight charts”


