Replicating gsynth

The purpose of this post is to replicate the examples in the gsynth package for synthetic controls. This is a methodology for causal inference especially at the state level.

causal inference
synthetic controls
econometrics
Author
Affiliation
Published

October 29, 2018

Introduction

Synthethic methods are a method of causal inference that seeks to combine traditional difference-in-difference types studies with time series cross sectional differences with factor analysis for uncontrolled/ unobserved measures. This method has been growing our of work initially from Abadie (Abadie, Diamond, and Hainmueller 2011a) and growing in importance/ research for state level policy analysis. It is interesting from the fact that it combines some elements of factor analysis to develop predictors and regression analysis to try to capture explained and unexplained variance.

Package

library(tidyverse)
── Attaching packages ─────────────────────────────────────── tidyverse 1.3.1 ──
✓ ggplot2 3.3.5.9000     ✓ purrr   0.3.4.9000
✓ tibble  3.1.6.9001     ✓ dplyr   1.0.8.9000
✓ tidyr   1.1.4.9000     ✓ stringr 1.4.0.9000
✓ readr   2.1.2          ✓ forcats 0.5.1     
── Conflicts ────────────────────────────────────────── tidyverse_conflicts() ──
x dplyr::filter() masks stats::filter()
x dplyr::lag()    masks stats::lag()
library(gsynth)
## Syntax has been updated since v.1.2.0.
## Comments and suggestions -> yiqingxu@stanford.edu.
library(panelView)
## See bit.ly/panelview4r for more info.
## Report bugs -> yiqingxu@stanford.edu.

Method Assumptions

This methodology makes several critical assumptions.

  1. The model takes the functional form of \[Y_{i,t}=\delta_{i,t}D_{i,t}+x_{i,t}^\prime\beta+\lambda_i^{\prime}f_i+\epsilon_{i,t}\]
  2. Strict exogeneity (e.g. the error terms are indepdent to D, X, \(\lambda\) and f)
  3. Weak serial dependence of the error terms
  4. Regularity of conditions

The method then uses bootstrapping for confidence intervals.

There is some basic data available in the package

data(gsynth)

The data that will be initially used will be the simdata dataset

id time Y D X1 X2 eff error mu alpha xi F1 L1 F2 L2
127 6 13.71 0 1.85 2.19 0.00 -0.14 5 -0.35 0.70 1.52 0.15 0.33 -0.42
112 12 4.39 0 -1.53 1.41 0.00 -0.90 5 -0.25 -1.46 -0.50 -0.16 0.55 -1.40
125 7 0.35 0 -0.24 -1.04 0.00 0.56 5 -0.65 -0.26 -1.55 0.54 1.10 -0.09
108 21 3.05 0 -0.25 -0.62 0.45 1.50 5 0.21 -0.28 -0.49 1.36 -0.71 0.88
108 19 15.04 0 2.01 2.87 0.00 -0.83 5 0.21 -1.01 0.92 1.36 -0.24 0.88
136 7 9.13 0 1.34 1.06 0.00 -0.99 5 0.99 -0.26 -1.55 -0.08 1.10 -0.23
110 15 7.01 0 3.53 0.13 0.00 -1.64 5 1.44 -1.29 -1.07 -0.15 1.36 -0.43
129 3 14.93 0 1.72 1.07 0.00 2.42 5 1.62 0.74 -0.04 -0.73 -0.37 -0.51
131 11 12.52 0 2.29 2.44 0.00 -0.45 5 -0.84 -0.53 0.38 1.60 0.99 -0.89
135 9 6.72 0 -0.38 1.04 0.00 0.16 5 0.11 -1.51 0.12 -1.65 -0.33 -1.38
131 30 9.94 0 2.80 1.69 8.30 -0.63 5 -0.84 -0.42 -0.14 1.60 0.92 -0.89
110 26 12.76 0 -0.40 1.64 4.78 0.87 5 1.44 1.05 1.03 -0.15 -0.05 -0.43
109 20 7.48 0 0.93 0.91 0.00 -0.72 5 0.69 -0.12 2.05 0.18 -1.03 1.37
103 16 9.22 0 0.93 0.91 0.00 -0.79 5 1.48 0.79 0.30 0.38 -0.60 1.73
134 23 13.64 0 1.65 2.46 2.87 -0.01 5 -0.81 -0.37 1.01 1.02 -0.25 1.00
148 30 -2.14 0 0.10 -1.10 10.99 -1.71 5 -0.53 -0.42 -0.14 -0.12 0.92 -1.41
120 7 3.62 0 -0.05 -0.14 0.00 0.99 5 1.05 -0.26 -1.55 1.57 1.10 -0.21
141 2 7.06 0 0.15 0.35 0.00 1.31 5 1.47 -1.46 -0.03 -1.24 0.39 -1.28
141 13 17.50 0 0.81 3.32 0.00 -0.55 5 1.47 0.69 -0.33 -1.24 0.24 -1.28
150 19 15.38 0 1.71 2.63 0.00 0.64 5 0.01 -1.01 0.92 1.24 -0.24 0.04
109 29 12.14 0 -0.18 1.63 8.78 -1.01 5 0.69 3.24 0.18 0.18 -0.38 1.37
142 11 11.30 0 1.32 0.83 0.00 1.29 5 1.32 -0.53 0.38 -0.30 0.99 0.53
109 8 16.90 0 3.02 2.80 0.00 0.65 5 0.69 -1.57 0.58 0.18 0.44 1.37
134 15 12.68 0 -0.23 2.75 0.00 1.48 5 -0.81 -1.29 -1.07 1.02 1.36 1.00
108 10 16.08 0 3.06 2.55 0.00 0.48 5 0.21 -1.60 0.22 1.36 1.15 0.88

It can be examined via the panelView package:

panelview(Y ~ D, data = simdata,  index = c("id","time")) 

panelview(Y ~ D, data = simdata,  index = c("id","time"), type = "raw") 

Modeling

out <- gsynth(Y ~ D + X1 + X2, data = simdata, 
                  index = c("id","time"), force = "two-way",
                  CV = TRUE, r = c(0, 5), se = TRUE, 
                  inference = "parametric", nboots = 1000,
                  parallel = FALSE)
Cross-validating ... 
 r = 0; sigma2 = 1.84865; IC = 1.02023; PC = 1.74458; MSPE = 2.37280
 r = 1; sigma2 = 1.51541; IC = 1.20588; PC = 1.99818; MSPE = 1.71743
 r = 2; sigma2 = 0.99737; IC = 1.16130; PC = 1.69046; MSPE = 1.14540*
 r = 3; sigma2 = 0.94664; IC = 1.47216; PC = 1.96215; MSPE = 1.15032
 r = 4; sigma2 = 0.89411; IC = 1.76745; PC = 2.19241; MSPE = 1.21397
 r = 5; sigma2 = 0.85060; IC = 2.05928; PC = 2.40964; MSPE = 1.23876

 r* = 2


Simulating errors .............
Bootstrapping ...
..........
print(out)
Call:
gsynth.formula(formula = Y ~ D + X1 + X2, data = simdata, index = c("id", 
    "time"), force = "two-way", r = c(0, 5), CV = TRUE, se = TRUE, 
    nboots = 1000, inference = "parametric", parallel = FALSE)

Average Treatment Effect on the Treated:
        Estimate   S.E. CI.lower CI.upper p.value
ATT.avg    5.544 0.2521    5.049    6.038       0

   ~ by Period (including Pre-treatment Periods):
          ATT   S.E. CI.lower CI.upper   p.value n.Treated
-19  0.392160 0.5859  -0.7562  1.54054 5.033e-01         0
-18  0.276548 0.4509  -0.6072  1.16031 5.397e-01         0
-17 -0.275393 0.4935  -1.2427  0.69190 5.768e-01         0
-16  0.441201 0.4396  -0.4205  1.30289 3.156e-01         0
-15 -0.889595 0.5067  -1.8828  0.10359 7.917e-02         0
-14  0.593891 0.4823  -0.3513  1.53909 2.181e-01         0
-13  0.528749 0.3960  -0.2473  1.30480 1.817e-01         0
-12  0.171569 0.5745  -0.9545  1.29762 7.652e-01         0
-11  0.610832 0.4729  -0.3160  1.53763 1.964e-01         0
-10  0.170597 0.4750  -0.7604  1.10163 7.195e-01         0
-9  -0.271892 0.5773  -1.4034  0.85959 6.377e-01         0
-8   0.094843 0.4925  -0.8704  1.06008 8.473e-01         0
-7  -0.651976 0.5312  -1.6931  0.38918 2.197e-01         0
-6   0.573686 0.4869  -0.3806  1.52795 2.387e-01         0
-5  -0.469686 0.5011  -1.4518  0.51239 3.486e-01         0
-4  -0.077766 0.5549  -1.1653  1.00979 8.885e-01         0
-3  -0.141785 0.5539  -1.2275  0.94388 7.980e-01         0
-2  -0.157100 0.3748  -0.8917  0.57748 6.751e-01         0
-1  -0.915575 0.5051  -1.9055  0.07434 6.987e-02         0
0   -0.003309 0.3455  -0.6804  0.67382 9.924e-01         0
1    1.235962 0.6865  -0.1096  2.58150 7.180e-02         5
2    1.630264 0.5678   0.5173  2.74321 4.092e-03         5
3    2.712178 0.5836   1.5684  3.85599 3.361e-06         5
4    3.466758 0.7068   2.0815  4.85199 9.338e-07         5
5    5.740132 0.5131   4.7346  6.74571 0.000e+00         5
6    5.280035 0.5820   4.1393  6.42077 0.000e+00         5
7    8.436485 0.4645   7.5261  9.34687 0.000e+00         5
8    7.839902 0.6348   6.5957  9.08407 0.000e+00         5
9    9.455115 0.5320   8.4124 10.49779 0.000e+00         5
10   9.638509 0.4702   8.7169 10.56009 0.000e+00         5

Coefficients for the Covariates:
    beta    S.E. CI.lower CI.upper p.value
X1 1.022 0.02936   0.9643    1.079       0
X2 3.053 0.02989   2.9944    3.112       0
out$est.att
             ATT      S.E.   CI.lower    CI.upper      p.value n.Treated
-19  0.392159788 0.5859169 -0.7562162  1.54053575 5.032980e-01         0
-18  0.276547958 0.4509094 -0.6072181  1.16031405 5.396703e-01         0
-17 -0.275392926 0.4935264 -1.2426870  0.69190114 5.768372e-01         0
-16  0.441201288 0.4396455 -0.4204880  1.30289054 3.156009e-01         0
-15 -0.889595124 0.5067364 -1.8827802  0.10358994 7.916728e-02         0
-14  0.593890957 0.4822546 -0.3513106  1.53909252 2.181402e-01         0
-13  0.528749012 0.3959513 -0.2473013  1.30479930 1.817491e-01         0
-12  0.171568737 0.5745280 -0.9544855  1.29762299 7.652258e-01         0
-11  0.610832288 0.4728667 -0.3159694  1.53763397 1.964388e-01         0
-10  0.170597468 0.4750257 -0.7604358  1.10163075 7.194955e-01         0
-9  -0.271891657 0.5772960 -1.4033711  0.85958778 6.376590e-01         0
-8   0.094842558 0.4924788 -0.8703981  1.06008324 8.472863e-01         0
-7  -0.651975701 0.5312128 -1.6931337  0.38918234 2.196970e-01         0
-6   0.573686472 0.4868788 -0.3805785  1.52795142 2.386793e-01         0
-5  -0.469685905 0.5010664 -1.4517580  0.51238615 3.485669e-01         0
-4  -0.077766449 0.5548839 -1.1653190  1.00978606 8.885422e-01         0
-3  -0.141784521 0.5539217 -1.2274511  0.94388205 7.979779e-01         0
-2  -0.157100323 0.3747931 -0.8916812  0.57748057 6.750952e-01         0
-1  -0.915575087 0.5050680 -1.9054902  0.07433998 6.986639e-02         0
0   -0.003308833 0.3454817 -0.6804406  0.67382292 9.923584e-01         0
1    1.235962010 0.6865104 -0.1095737  2.58149768 7.180470e-02         5
2    1.630264312 0.5678415  0.5173154  2.74321319 4.091952e-03         5
3    2.712177702 0.5835872  1.5683677  3.85598769 3.361050e-06         5
4    3.466757691 0.7067657  2.0815223  4.85199305 9.337898e-07         5
5    5.740132310 0.5130594  4.7345544  6.74571021 0.000000e+00         5
6    5.280034526 0.5820196  4.1392970  6.42077205 0.000000e+00         5
7    8.436484821 0.4644907  7.5260998  9.34686989 0.000000e+00         5
8    7.839901526 0.6347913  6.5957335  9.08406955 0.000000e+00         5
9    9.455114684 0.5319883  8.4124368 10.49779258 0.000000e+00         5
10   9.638509457 0.4702021  8.7169304 10.56008856 0.000000e+00         5
out$est.avg
        Estimate      S.E. CI.lower CI.upper p.value
ATT.avg 5.543534 0.2520962 5.049434 6.037633       0
out$est.beta
       beta       S.E.  CI.lower CI.upper p.value
X1 1.021890 0.02936027 0.9643451 1.079435       0
X2 3.052994 0.02988840 2.9944142 3.111575       0

The default plot:

plot(out) +
  theme(plot.title = element_text(size = 12))

Modified:

plot(out, theme.bw = TRUE) +
  theme(plot.title = element_text(size = 12))

With the raw data:

plot(out, type = "raw", theme.bw = TRUE)+
  theme(plot.title = element_text(size = 12))

plot(out,type = "raw", legendOff = TRUE, ylim=c(-10,40), main="")+
  theme(plot.title = element_text(size = 12))

plot(out, type = "counterfactual", raw = "none", main="")+
  theme(plot.title = element_text(size = 12))

plot(out, type = "counterfactual", raw = "band", xlab = "Time", 
     ylim = c(-5,35), theme.bw = TRUE)+
  theme(plot.title = element_text(size = 12))
Warning in quantile.default(newX[, i], ...): partial argument match of 'prob' to
'probs'

Warning in quantile.default(newX[, i], ...): partial argument match of 'prob' to
'probs'

Warning in quantile.default(newX[, i], ...): partial argument match of 'prob' to
'probs'

Warning in quantile.default(newX[, i], ...): partial argument match of 'prob' to
'probs'

Warning in quantile.default(newX[, i], ...): partial argument match of 'prob' to
'probs'

Warning in quantile.default(newX[, i], ...): partial argument match of 'prob' to
'probs'

Warning in quantile.default(newX[, i], ...): partial argument match of 'prob' to
'probs'

Warning in quantile.default(newX[, i], ...): partial argument match of 'prob' to
'probs'

Warning in quantile.default(newX[, i], ...): partial argument match of 'prob' to
'probs'

Warning in quantile.default(newX[, i], ...): partial argument match of 'prob' to
'probs'

Warning in quantile.default(newX[, i], ...): partial argument match of 'prob' to
'probs'

Warning in quantile.default(newX[, i], ...): partial argument match of 'prob' to
'probs'

Warning in quantile.default(newX[, i], ...): partial argument match of 'prob' to
'probs'

Warning in quantile.default(newX[, i], ...): partial argument match of 'prob' to
'probs'

Warning in quantile.default(newX[, i], ...): partial argument match of 'prob' to
'probs'

Warning in quantile.default(newX[, i], ...): partial argument match of 'prob' to
'probs'

Warning in quantile.default(newX[, i], ...): partial argument match of 'prob' to
'probs'

Warning in quantile.default(newX[, i], ...): partial argument match of 'prob' to
'probs'

Warning in quantile.default(newX[, i], ...): partial argument match of 'prob' to
'probs'

Warning in quantile.default(newX[, i], ...): partial argument match of 'prob' to
'probs'

Warning in quantile.default(newX[, i], ...): partial argument match of 'prob' to
'probs'

Warning in quantile.default(newX[, i], ...): partial argument match of 'prob' to
'probs'

Warning in quantile.default(newX[, i], ...): partial argument match of 'prob' to
'probs'

Warning in quantile.default(newX[, i], ...): partial argument match of 'prob' to
'probs'

Warning in quantile.default(newX[, i], ...): partial argument match of 'prob' to
'probs'

Warning in quantile.default(newX[, i], ...): partial argument match of 'prob' to
'probs'
Warning in quantile.default(newX[, i], ...): partial argument match of 'prob' to
'probs'

Warning in quantile.default(newX[, i], ...): partial argument match of 'prob' to
'probs'

Warning in quantile.default(newX[, i], ...): partial argument match of 'prob' to
'probs'

Warning in quantile.default(newX[, i], ...): partial argument match of 'prob' to
'probs'

Warning in quantile.default(newX[, i], ...): partial argument match of 'prob' to
'probs'

Warning in quantile.default(newX[, i], ...): partial argument match of 'prob' to
'probs'

Warning in quantile.default(newX[, i], ...): partial argument match of 'prob' to
'probs'

Warning in quantile.default(newX[, i], ...): partial argument match of 'prob' to
'probs'

Warning in quantile.default(newX[, i], ...): partial argument match of 'prob' to
'probs'

Warning in quantile.default(newX[, i], ...): partial argument match of 'prob' to
'probs'

Warning in quantile.default(newX[, i], ...): partial argument match of 'prob' to
'probs'

Warning in quantile.default(newX[, i], ...): partial argument match of 'prob' to
'probs'

Warning in quantile.default(newX[, i], ...): partial argument match of 'prob' to
'probs'

Warning in quantile.default(newX[, i], ...): partial argument match of 'prob' to
'probs'

Warning in quantile.default(newX[, i], ...): partial argument match of 'prob' to
'probs'

Warning in quantile.default(newX[, i], ...): partial argument match of 'prob' to
'probs'

Warning in quantile.default(newX[, i], ...): partial argument match of 'prob' to
'probs'

Warning in quantile.default(newX[, i], ...): partial argument match of 'prob' to
'probs'

Warning in quantile.default(newX[, i], ...): partial argument match of 'prob' to
'probs'

Warning in quantile.default(newX[, i], ...): partial argument match of 'prob' to
'probs'

Warning in quantile.default(newX[, i], ...): partial argument match of 'prob' to
'probs'

Warning in quantile.default(newX[, i], ...): partial argument match of 'prob' to
'probs'

Warning in quantile.default(newX[, i], ...): partial argument match of 'prob' to
'probs'

Warning in quantile.default(newX[, i], ...): partial argument match of 'prob' to
'probs'

Warning in quantile.default(newX[, i], ...): partial argument match of 'prob' to
'probs'

Warning in quantile.default(newX[, i], ...): partial argument match of 'prob' to
'probs'

Warning in quantile.default(newX[, i], ...): partial argument match of 'prob' to
'probs'

Warning in quantile.default(newX[, i], ...): partial argument match of 'prob' to
'probs'

Warning in quantile.default(newX[, i], ...): partial argument match of 'prob' to
'probs'

Warning in quantile.default(newX[, i], ...): partial argument match of 'prob' to
'probs'

Warning in quantile.default(newX[, i], ...): partial argument match of 'prob' to
'probs'

Warning in quantile.default(newX[, i], ...): partial argument match of 'prob' to
'probs'

Warning in quantile.default(newX[, i], ...): partial argument match of 'prob' to
'probs'

Warning in quantile.default(newX[, i], ...): partial argument match of 'prob' to
'probs'

plot(out, type = "counterfactual", raw = "all")+
  theme(plot.title = element_text(size = 12))

plot(out, type = "factors", xlab = "Time")+
  theme(plot.title = element_text(size = 12))

Voter Turnout

Now I am going to try to reproduce the results from Xu’s paper [xu_generalized_2017] and implemented in his package (Xu and Liu 2018).

Data

abb year turnout policy_edr policy_mail_in policy_motor
AL 1920 21.02107 0 0 0
AL 1924 13.58233 0 0 0
AL 1928 19.03850 0 0 0
AL 1932 17.62002 0 0 0
AL 1936 18.69238 0 0 0
AL 1940 18.86406 0 0 0

Model

The paper builds two models, one will only the impact of voter education, another with additional controls. For the sake of time I will build the model with all of the controls used.

out <- gsynth(turnout ~ policy_edr + policy_mail_in + policy_motor, data = turnout, 
                  index = c("abb","year"), force = "two-way",
                  CV = TRUE, r = c(0, 5), se = TRUE, 
                  inference = "parametric", nboots = 1000,
                  parallel = FALSE)
Cross-validating ... 
 r = 0; sigma2 = 77.99366; IC = 4.82744; PC = 72.60594; MSPE = 22.13889
 r = 1; sigma2 = 13.65239; IC = 3.52566; PC = 21.67581; MSPE = 12.03686
 r = 2; sigma2 = 8.56312; IC = 3.48518; PC = 19.23841; MSPE = 10.31254*
 r = 3; sigma2 = 6.40268; IC = 3.60547; PC = 18.61783; MSPE = 11.48390
 r = 4; sigma2 = 4.74273; IC = 3.70145; PC = 16.93707; MSPE = 16.28613
 r = 5; sigma2 = 4.02488; IC = 3.91847; PC = 17.05226; MSPE = 15.78683

 r* = 2


Simulating errors .............
Bootstrapping ...
..........

The model completed and appeared that it did well. Now to examine the figures to see if they match:

plot(out)

Now we can look at the estimated average treatment

out$est.avg %>% 
  knitr::kable()
Estimate S.E. CI.lower CI.upper p.value
ATT.avg 4.895788 2.370876 0.2489566 9.54262 0.0389258
plot(out, type = "counterfactual", raw = "all")+
  theme(plot.title = element_text(size = 12))

Warning: Removed 81 row(s) containing missing values (geom_path).

Now with Synth

Now I want to try to replicate the previous case study used in Synth (Abadie, Diamond, and Hainmueller 2011b) and see if it is possible.

library(Synth)
##
## Synth Package: Implements Synthetic Control Methods.
## See http://www.mit.edu/~jhainm/software.htm for additional information.

I am going to recode some variable in order to fit with the methods used in gsynth. The Synth package uses a dataprep function in order to format the data into the requirements.

data("basque")
basque_treat <- basque %>% 
  mutate(treat = ifelse(grepl(pattern = "Basque", x = regionname) & year > 1969,1,0))
head(basque_treat) %>% 
  knitr::kable()
regionno regionname year gdpcap sec.agriculture sec.energy sec.industry sec.construction sec.services.venta sec.services.nonventa school.illit school.prim school.med school.high school.post.high popdens invest treat
1 Spain (Espana) 1955 2.354542 NA NA NA NA NA NA NA NA NA NA NA NA NA 0
1 Spain (Espana) 1956 2.480149 NA NA NA NA NA NA NA NA NA NA NA NA NA 0
1 Spain (Espana) 1957 2.603613 NA NA NA NA NA NA NA NA NA NA NA NA NA 0
1 Spain (Espana) 1958 2.637104 NA NA NA NA NA NA NA NA NA NA NA NA NA 0
1 Spain (Espana) 1959 2.669880 NA NA NA NA NA NA NA NA NA NA NA NA NA 0
1 Spain (Espana) 1960 2.869966 NA NA NA NA NA NA NA NA NA NA NA NA NA 0
out_basque <- gsynth(gdpcap ~ treat, data = basque_treat, index = c("regionname","year"), force = "two-way",
                  CV = TRUE, r = c(0, 5), se = TRUE, 
                  inference = "parametric", nboots = 1000,
                  parallel = FALSE, )
Cross-validating ... 
 r = 0; sigma2 = 0.15833; IC = -1.31080; PC = 0.14556; MSPE = 0.02963
 r = 1; sigma2 = 0.02499; IC = -2.64303; PC = 0.04627; MSPE = 0.00994
 r = 2; sigma2 = 0.00985; IC = -3.07772; PC = 0.02745; MSPE = 0.00755*
 r = 3; sigma2 = 0.00581; IC = -3.12683; PC = 0.02166; MSPE = 0.00981
 r = 4; sigma2 = 0.00395; IC = -3.05355; PC = 0.01843; MSPE = 0.00329
 r = 5; sigma2 = 0.00256; IC = -3.04564; PC = 0.01435; MSPE = 0.00260

 r* = 5


Simulating errors .............
Bootstrapping ...
..........

Let’s check the results

plot(out_basque)+
  theme(plot.title = element_text(size = 12))

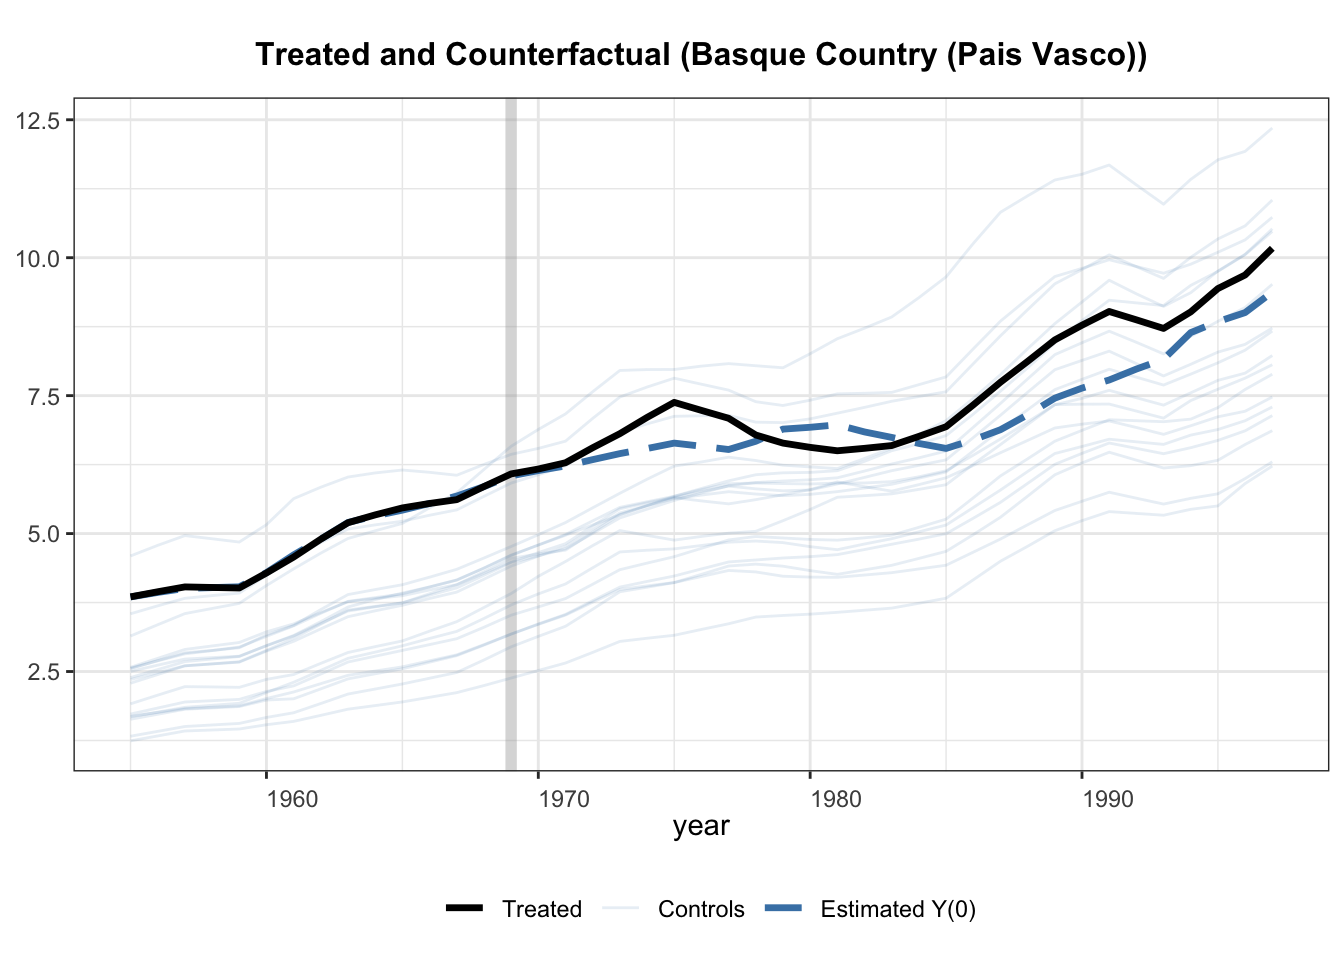
plot(out_basque, type = "counterfactual", raw = "all")+
  theme(plot.title = element_text(size = 12))

Interesting that this method lands on a slightly different estimate than the previous paper. I think that this is due to some missing covariates. It appears that gsynth doesn’t handle missing data too well, which is ok.

Thoughts

I think that a combination of Bayesian Hierarchical modeling with structural timeseries modeling could get somewhere close to the method, and take advantage of specifying knowns, group effects, etc. But the method is neat and a good way to do some quick analysis.

References

Abadie, Alberto, Alexis Diamond, and Jens Hainmueller. 2011a. Synth: An R Package for Synthetic Control Methods in Comparative Case Studies.” Journal of Statistical Software 42 (13): 1–17. http://www.jstatsoft.org/v42/i13/.
———. 2011b. “Synth: An r Package for Synthetic Control Methods in Comparative Case Studies.” Journal of Statistical Software, Articles 42 (13): 1–17. https://doi.org/10.18637/jss.v042.i13.
Xu, Yiqing, and Licheng Liu. 2018. Gsynth: Generalized Synthetic Control Method. https://CRAN.R-project.org/package=gsynth.

Reuse

Citation

BibTeX citation:
@online{dewitt2018,
  author = {Michael DeWitt},
  title = {Replicating Gsynth},
  date = {2018-10-29},
  url = {https://michaeldewittjr.com/programming/2018-10-28-replicating-gsynth},
  langid = {en}
}
For attribution, please cite this work as:
Michael DeWitt. 2018. “Replicating Gsynth.” October 29, 2018. https://michaeldewittjr.com/programming/2018-10-28-replicating-gsynth.